Programme & presentations
Proceedings:
All attendees have been sent instructions on how to access the presentations given at the workshop. EWEA members may access the proceedings free of charge via the Members’ Area. If you did not attend and are not from an EWEA member organisation please complete the proceedings order form.
Programme:
| Tuesday 25 June 2013 |
||
| 09:00-09:10 | Welcome | |
| 09:10-11:00 | Session 1: Application of mesoscale models for resource assessment Session description below |
|
| 11:30-13:30 | Session 2: Wind conditions modelling Session description below |
|
| 15:00-17:00 | Session 3: Real world power curves Session description below |
|
| 17:00-18:30 | Drinks reception at The Pavilion, Trinity College | |
| 19:00-23:00 | Workshop dinner for all participants including tour and tasting at the Old Jameson Distillery, Dublin | |
| Wednesday 26 June 2013 | ||
| 09:00-11:00 | Session 4: Current challenges of wake prediction Session description below |
|
| 11:30-13:30 | Session 5: Comparative Resource and Energy Yield Assessment Procedures Exercise – Part II Session description below |
|
Tuesday 25 June 2013
Opening Remarks: Tim Robinson, EWEA
Welcome: Kenneth Matthews, Chief Executive, Irish Wind Energy Association
Session 1:
Application of mesoscale models for resource assessment, with special focus on reducing uncertainties related to long term correlations
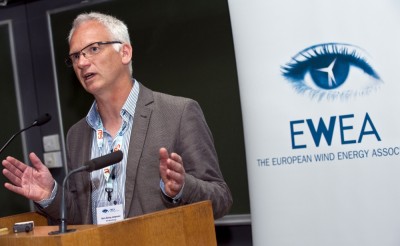 Chair: Hans Ejsing Jørgensen, Head of Meteorology Programme, DTU Wind Energy, Denmark
One of the sources to the large uncertainties in wind resource assessment has been identified to be within the topic of estimating the long term correlation of the wind. In the past, several methods of MCP (measure correlate predict) have been developed but several shortcomings have also been identified. These include the site of existing measurements being too far from the site of interest, the lack of measurement for a sufficiently long period and the lack of quality in the data. Recently, mesoscale models have shown to be a useful tool for the creation of the necessary long-term data.
This session covered some of the tools and theoretical background for the use of mesoscale models. The input to the mesoscale models are based on reanalysis data. Therefore the session started with a presentation of reanalysis data and their associated uncertainties. This was followed by a presentation of the state of art on mesoscale modelling on variability of different scales and will include a discussion on some of the limitations of mesoscale models. The theoretical description was followed by two presentations on the model chain used to calculate the long term correlation and provided the audience insight to the methods used by the consultant.
The principle of calculation the long term correlation is based on hindcast data. For predicting the future climate variability a combination of hindcast and climate forecast data are used. Several studies on the variability of winds due to climate change have been done in the past and the session closed with a conclusion on the variability in these climate runs with focus on the wind resource.
| 09:10- 09:15 |
Introduction to the session | Session chair |
| 09:15- 09:35 |
The use of renanalysis for the wind energy community | Paul Poli, Reanalysis Project (ERA), ECMWF – European Centre for Medium-Range Weather Forecasts, UK |
| 09:35- 09:55 |
10-years reanalysis downscaling at a 3km grid in the North Sea area | Idar Barstad, Researcher, Uni Computing Department, Uni Research Ltd, Norway |
| 09:55- 10:15 |
Some guidelines to infer and assess wind climate variability uncertainty from modelled time series | Gil Lizcano, Research and Development Director, Vortex, Spain |
| 10:15- 10:35 |
Representativeness of reanalysis and of mesoscale model datasets when used in the long-term correction of wind measurements | Sónia Liléo, Adviser, Wind resource analysis, Kjeller Vindteknikk, Sweden |
| 10:35- 11:00 |
Discussion with the audience | |
Session 2:
Wind conditions modelling
 Chair: Oisin Brady, Director, Natural Power France
Characterising the wind conditions across wind farm sites to a high degree of accuracy remains a persistent issue. The classic 2-D wind map is proving increasingly unfit for purpose as turbines increase in scale, sites increase in size and complexity, and the demands placed by plant operators and financiers ever more exacting. Of increasing concern is the need for an accurate description of wind speed, shear, veer, turbulence, and time dependant variations at various scales.
This session explored these issues and how they are being addressed through, among other things, significant progress in weather modelling, computation power and a merger of meteorological and engineering approaches to modelling. The insight brought by operation feedback of wind plant is adding considerable value to these developments and was considered here.
| 11:30- 11:35 |
Introduction to the session | Session chair |
| 11:35- 11:55 |
Evaluation of four numerical wind flow models for wind resource mapping | Michael Brower, Chief Technical Officer, AWS Truepower, USA |
| 11:55- 12:15 |
Visualising Forest Edge Effects | Ralph Torr, Senior Consultant, Analysis & Measurement, SgurrEnergy Ltd, UK |
| 12:15- 12:35 |
Stability classification for CFD simulations in complex terrains | Li Di, Site Assessment Engineer, WindSim AS, Norway |
| 12:35- 12:50 |
Wind conditions based on a one-way coupling between a mesoscale and microscale model | José M. Palma, Centre for Wind Energy and Atmospheric Flows, FEUP – Engineering Faculty, University of Porto, Portugal |
| 12:55- 13:30 |
Discussion with the audience | |
Session 3:
Real world power curves
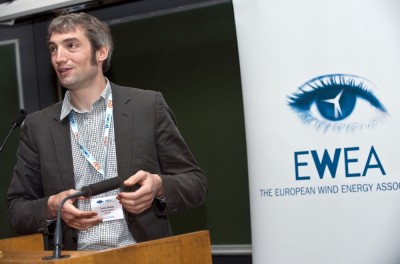 Chair: Tomas Blodau, Head of Department Wind and Site, REpower Systems, Germany
Practical experiences of handling power curves under real site conditions were presented from different points of view:
- pre-construction yield prediction;
- on-site power curve measurement.
These presentations were be rounded off by brief outlines of how different manufacturers respond to market demands for real world power curves and a discussion between presenters and audience.
| 15:00- 15:05 |
Introduction to the session | Session chair |
| 15:05- 15:25 |
Introduction to the Power Curve Working Group | Peter Stuart, Senior Technical Manager. RES Ltd, UK |
| 15:25- 15:45 |
Power curve behaviour in yield analysis | Andrew Tindal, Head of Energy, Senior Vice President, GL Garrad Hassan, UK |
| 15:45- 16:05 |
Power curve measurement experiences, and new approaches | Mark Young, Head of Department, Cleaner Energy, DNV KEMA Energy & Sustainability |
| 16:05- 16:20 |
Manufacturers’ approaches to guaranteeing real world conditions |
|
| 16:25- 17:00 |
Discussion with the audience | |
17:00-18:30: Drinks reception at The Pavilion, Trinity College
19:00-23:00: Workshop dinner for all participants including tour at the Old Jameson Distillery, Dublin.
Wednesday 26 June 2013
Session 4:
Current challenges of wake prediction
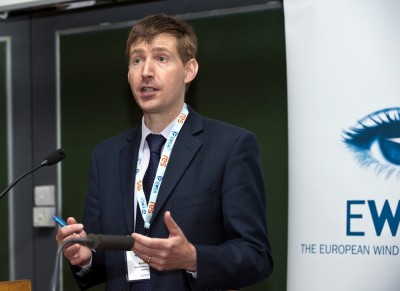 Chair: Andrew Tindal, Head of Energy, Senior Vice President, GL Garrad Hassan, UK
The accurate prediction of the wake effects within and between wind farms is vital to optimise wind farm design and to provide robust prediction of the future energy output of a project. The size of turbines and wind farms are getting larger, wind farms are being deployed in sites which experience an ever wider range of meteorological and atmospheric conditions and the density of projects in certain “hot spot” areas is increasing. All of these trends raise new challenges for developing and deploying wake models. This session explored how new methods which are becoming available for commercial deployment seek to address these challenges.
For an innovative model to be adopted by the industry validation against measurements is a necessary step. Obtaining and interpreting measured data for operational wind farms is essential both to improve our understanding of wakes and to provide validation data sets to test wake models against. However, the approaches adopted in the analysis of measured data can have a significant influence on the interpretation of the results. Such issues include the selection of averaging periods, the selection of wind speed and direction bin sizes the decision of whether to bin by atmospheric conditions as well as dealing with wind farm operational issues such as turbine down times. Understanding what element of patterns in the data can be attributed to wake influence and what patterns are simply the ambient flow conditions at a site is a further challenge for the analyst seeking to validate a new wake model.
The presenters invited to this session all have long experience in this field. Their presentations provided some answers to where the state of the art currently lies in addressing the challenges of predicting wake effects for the current and future generation of wind farms.
Computational speed is always an issue for the wake modeller. Given that wake effects are sensitive to both wind direction and wind speed it is normal for some thousands of flow cases to be considered in building a full picture of the wake effects at a wind farm. The likely computational power and run times needed to model the energy output of a wind farm for any models was covered by the presenters.
| 09:00- 09:10 |
Introduction to the session | Session chair |
| 09:10- 09:35 |
The experiences of an offshore developer / owner in understanding and predicting the wake effects within and between wind farms. The challenges in interpreting wake effects from measured operational data. | Leo Enrico Jensen, Senior Manager, Chief Specialist, Wind Power Technology, DONG Energy, Denmark |
| 09:35- 10:00 |
What have we learned about understanding and modelling wake effects from the WakeBench project? | Stefan Ivanell, Associate Professor and Director of Energy Technology, Gotland University, Sweden |
| 10:00- 10:25 |
Latest development in predicting the wake effects within and between large offshore wind farms. | Søren Ott, Senior Scientist, DTU Wind Energy, Denmark |
| 10:25- 11:00 |
Questions & answers session with the audience | |
Session 5:
Comparative Resource and Energy Yield Assessment Procedures (CREYAP) Exercise – Part II
See revisions to CREYAP Exercise II data pack – 16 July 2013
 Chair: Mike Anderson, Group Technical Director, Renewable Energy Systems Ltd, UK
The economics of a wind farm project are crucially dependent on the wind resource at a site. A robust estimate of the energy production of a prospective wind farm based on a wind and energy assessment is essential in supporting investment and financing decisions. The process of undertaking a resource assessment is a complex undertaking which involves skill and judgement coupled with a firm understanding of the employed numerical models.
In 2011 a Comparative Resource and Energy Yield Assessment Procedures Exercise was undertaken as part of a EWEA Resource Assessment Workshop 2011. A total of 36 organisations from around the globe participated in the exercise to produce a high population of results for comparison and analysis. These formed the basis for an insightful analysis into the range and variation of site assessment results obtained from the wide spread of organisations involved and these results have been presented at various international conferences.
In the interest of building on the 2011 exercise, a new assessment scenario has been devised which will incorporate a number of additional components (namely, varying surface roughness and multiple site assessment masts). There will also be the added benefit of being able to compare the results with real production data from the wind farm site in question.
Between February and May 2013 parties were invited to download a high quality data pack with all the information required to perform an independent pre-construction assessment of the energy production of a wind farm.
60 teams from 56 organisations in 17 countries took part and the results of the participant’s assessments (P50 and P90 estimates) were independently compared and contrasted with one another, as well as against real wind farm performance data. The final results were presented anonymously in this concluding session.
The results of this assessment are vital in gaining an understanding of the differing approaches and will hopefully lead to a consensus on how loss adjustment factors are arrived at and the levels of uncertainty which are apportioned to the various elements of the process.
| 11:30- 11:40 |
Introduction to the session | Session chair |
| 11:40- 11:45 |
MCP and long term wind speed predictions | Frank Klintø, Wind & Site Engineer, Suzlon Wind Energy A/S, Denmark |
| 11:45- 12:05 |
Conclusions of the previous sessions | Chairs of previous sessions:
|
| 12:05- 12:40 |
Presentation of the results of the Comparative Resource and Energy Yield Assessment Procedures Part II exercise | Niels Gylling Mortensen, Senior Researcher, DTU Wind Energy |
| 12:40- 13:00 |
Panel debate | |
| 13:00- 13:20 |
Questions & answers session with the audience | |
| 13:20- 13:30 |
Workshop conclusions | |
These leading companies exhibited at the workshop:
 |
 |
 |
 |
 |
 |
Follow EWEA on: